
Visualize+: Using Pre-Built Dashboards
Reach your practice goals efficiently by tracking key metrics using Healthie's pre-built dashboards. This guide will walk you through how to access and read your data so you can easily review your performance and make informed decisions.
IN THIS ARTICLE:
Opening a dashboard
Dashboards group a set of questions into tabs on a single page, and can be thought of as shareable reports that feature a set of related questions.
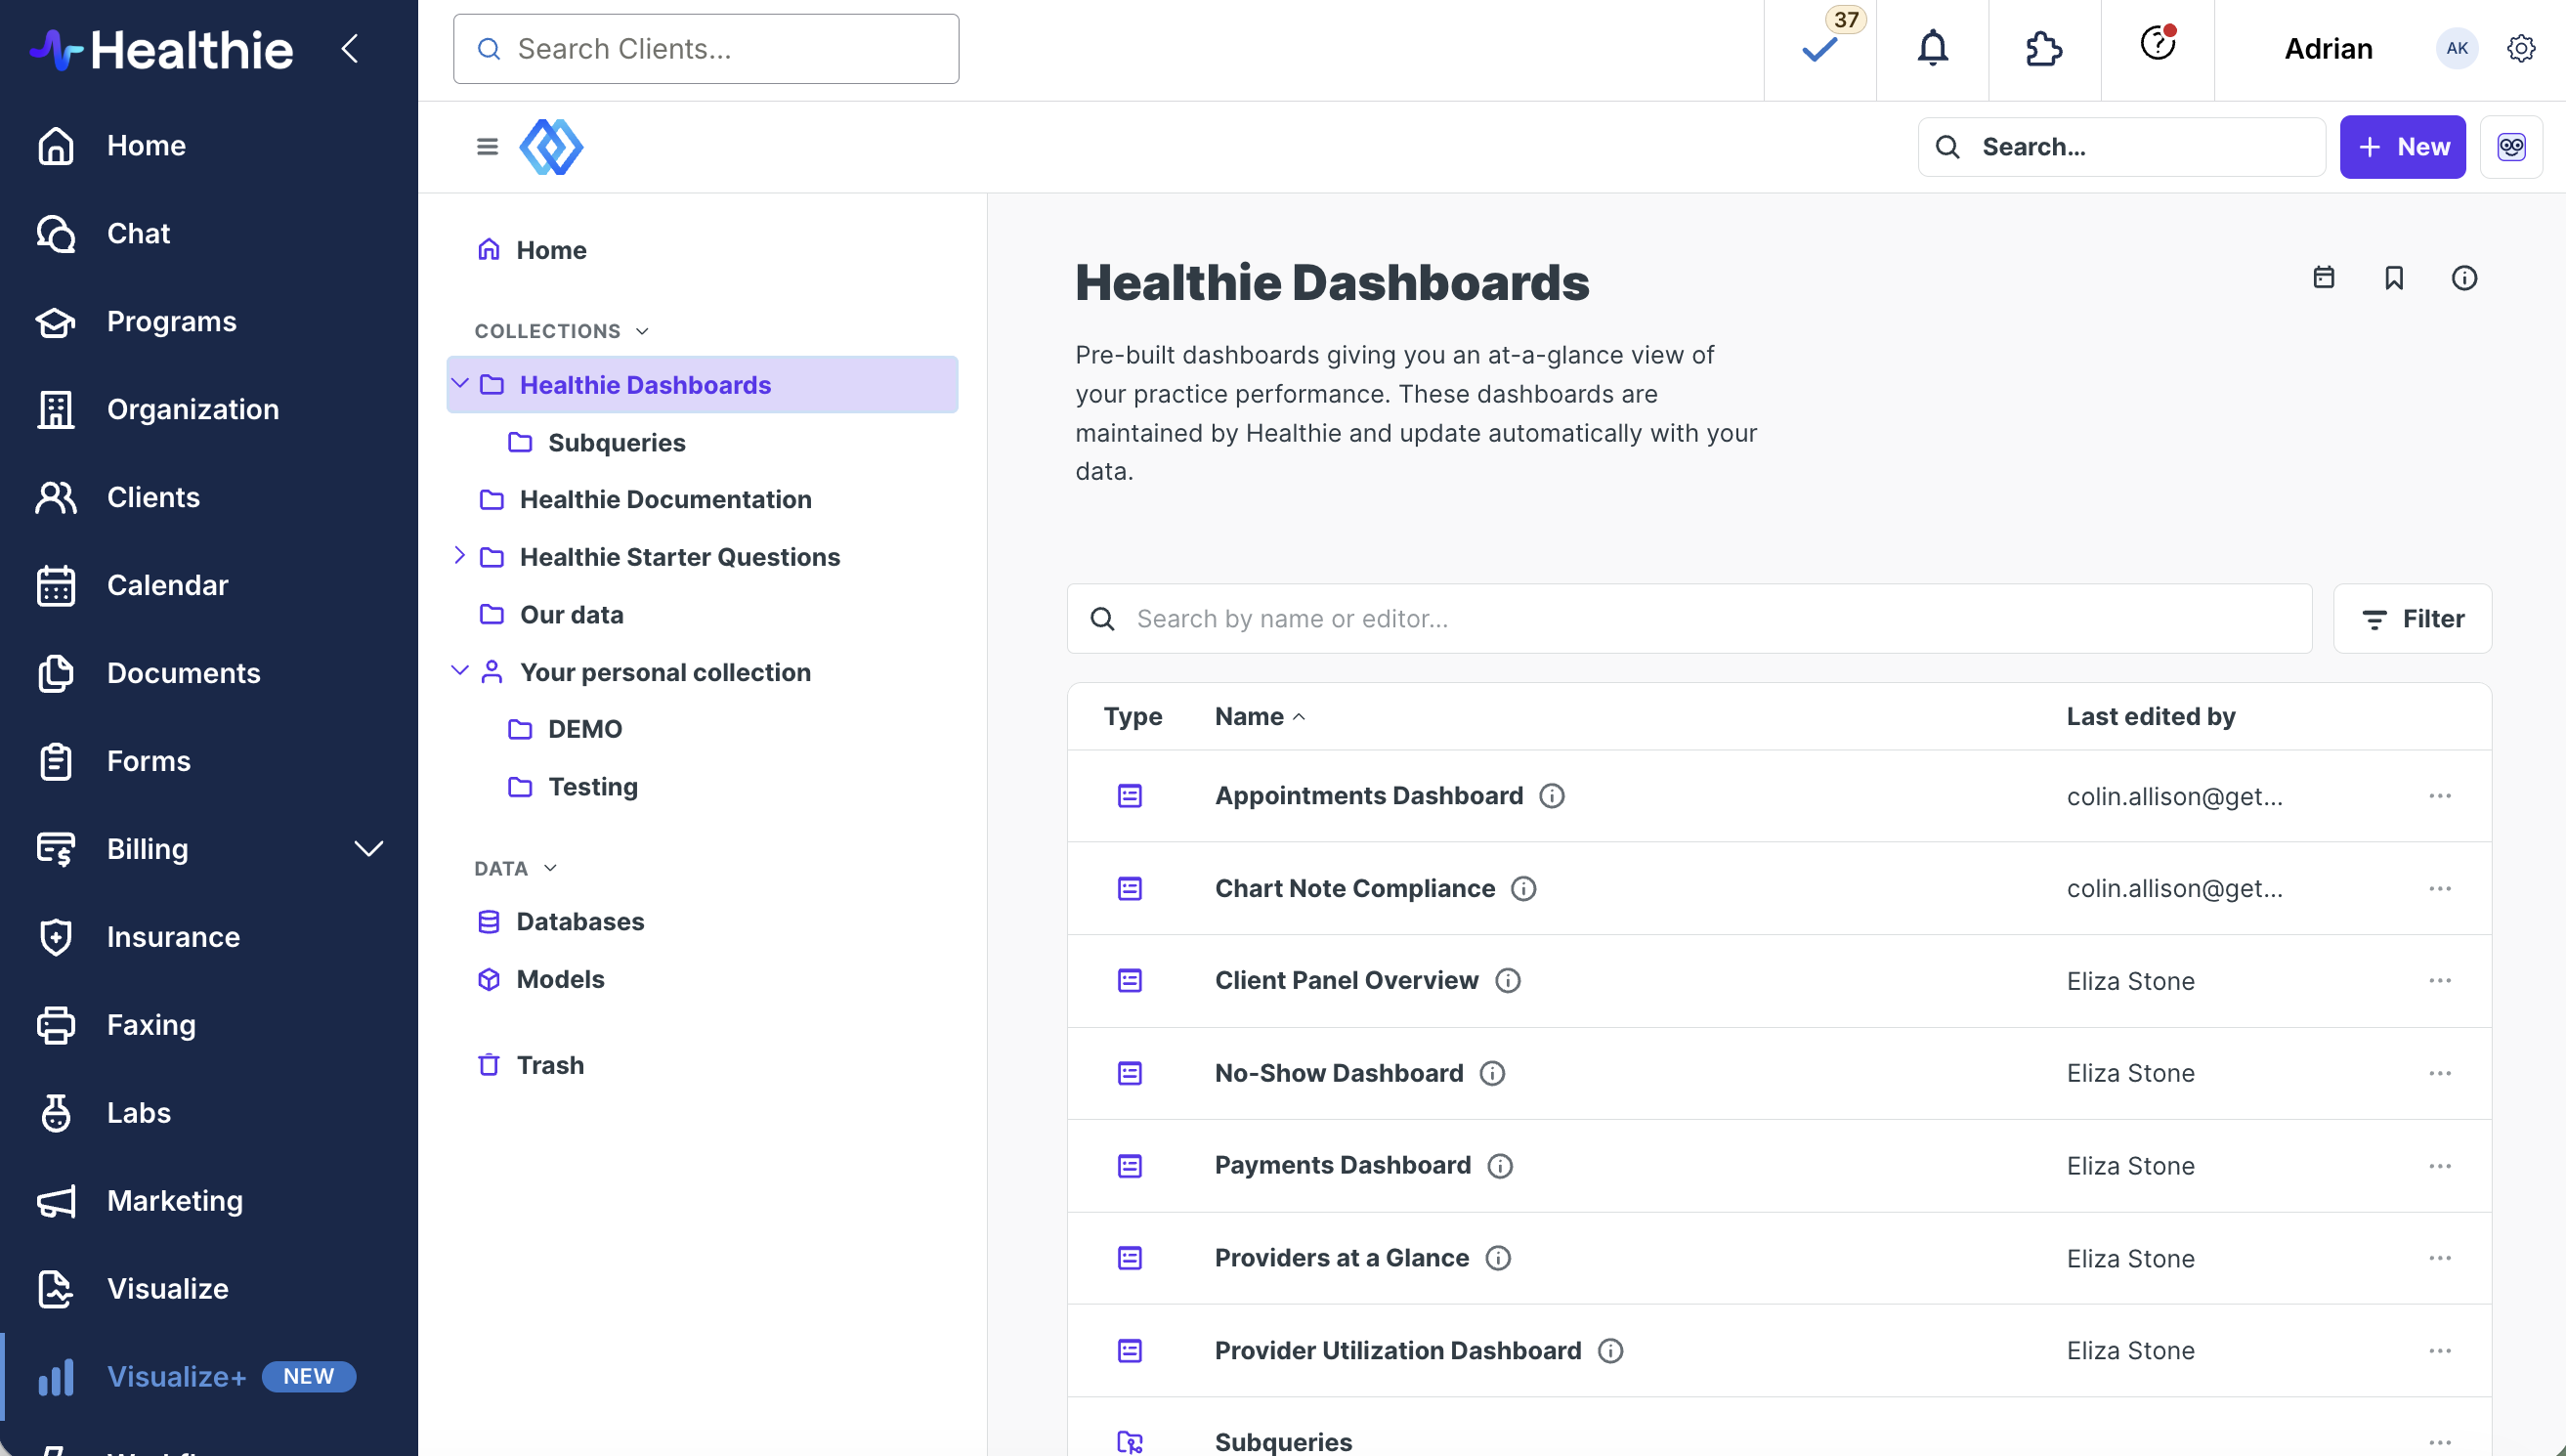
To get started, navigate to the Healthie Dashboards folder in your account. Here, you can select and open a variety of pre-built reports tailored to your needs.
Reading dashboard cards
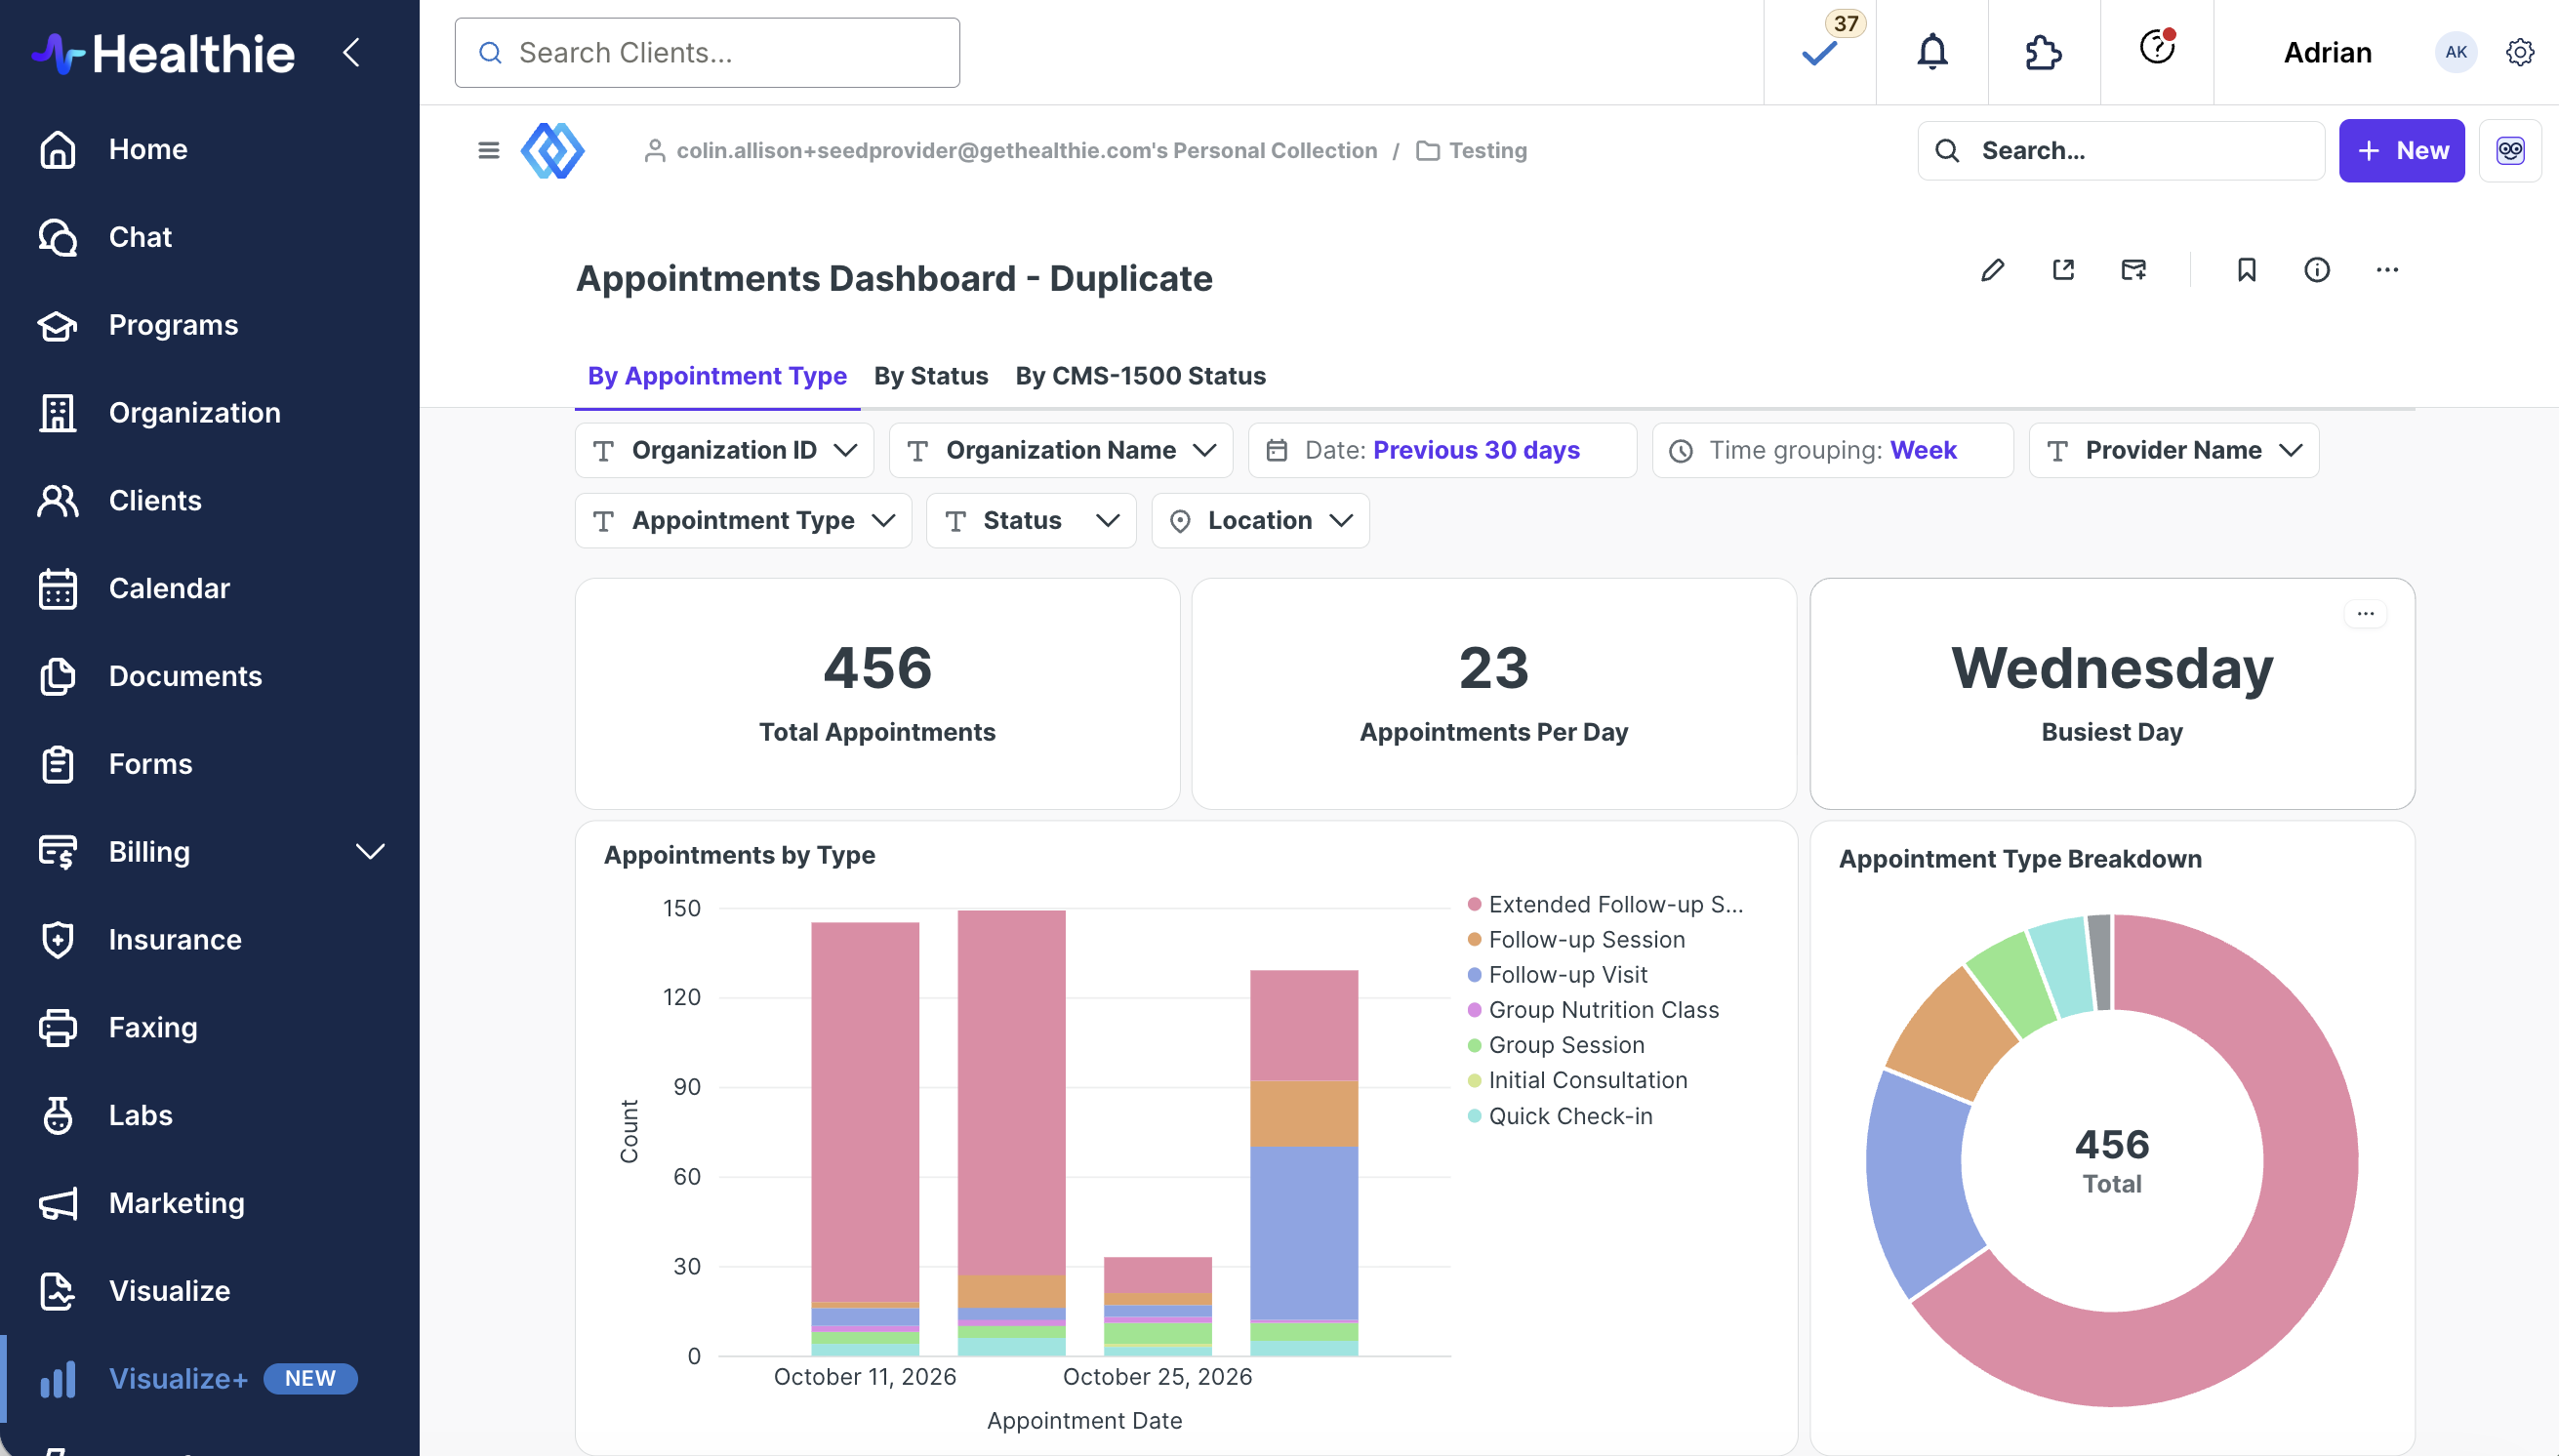
Once you open a dashboard, your information is displayed using visual dashboard cards. These cards come in different formats, including easy-to-read charts, trend lines, and quick-glance number tiles. This layout allows you to effortlessly scan your data to understand your progress at a glance.
Using dashboard tabs
For more detailed reports, your dashboard may be organized into multiple sections using tabs. If tabs are present at the top of your dashboard, simply click on them to seamlessly switch between different views and explore related data.
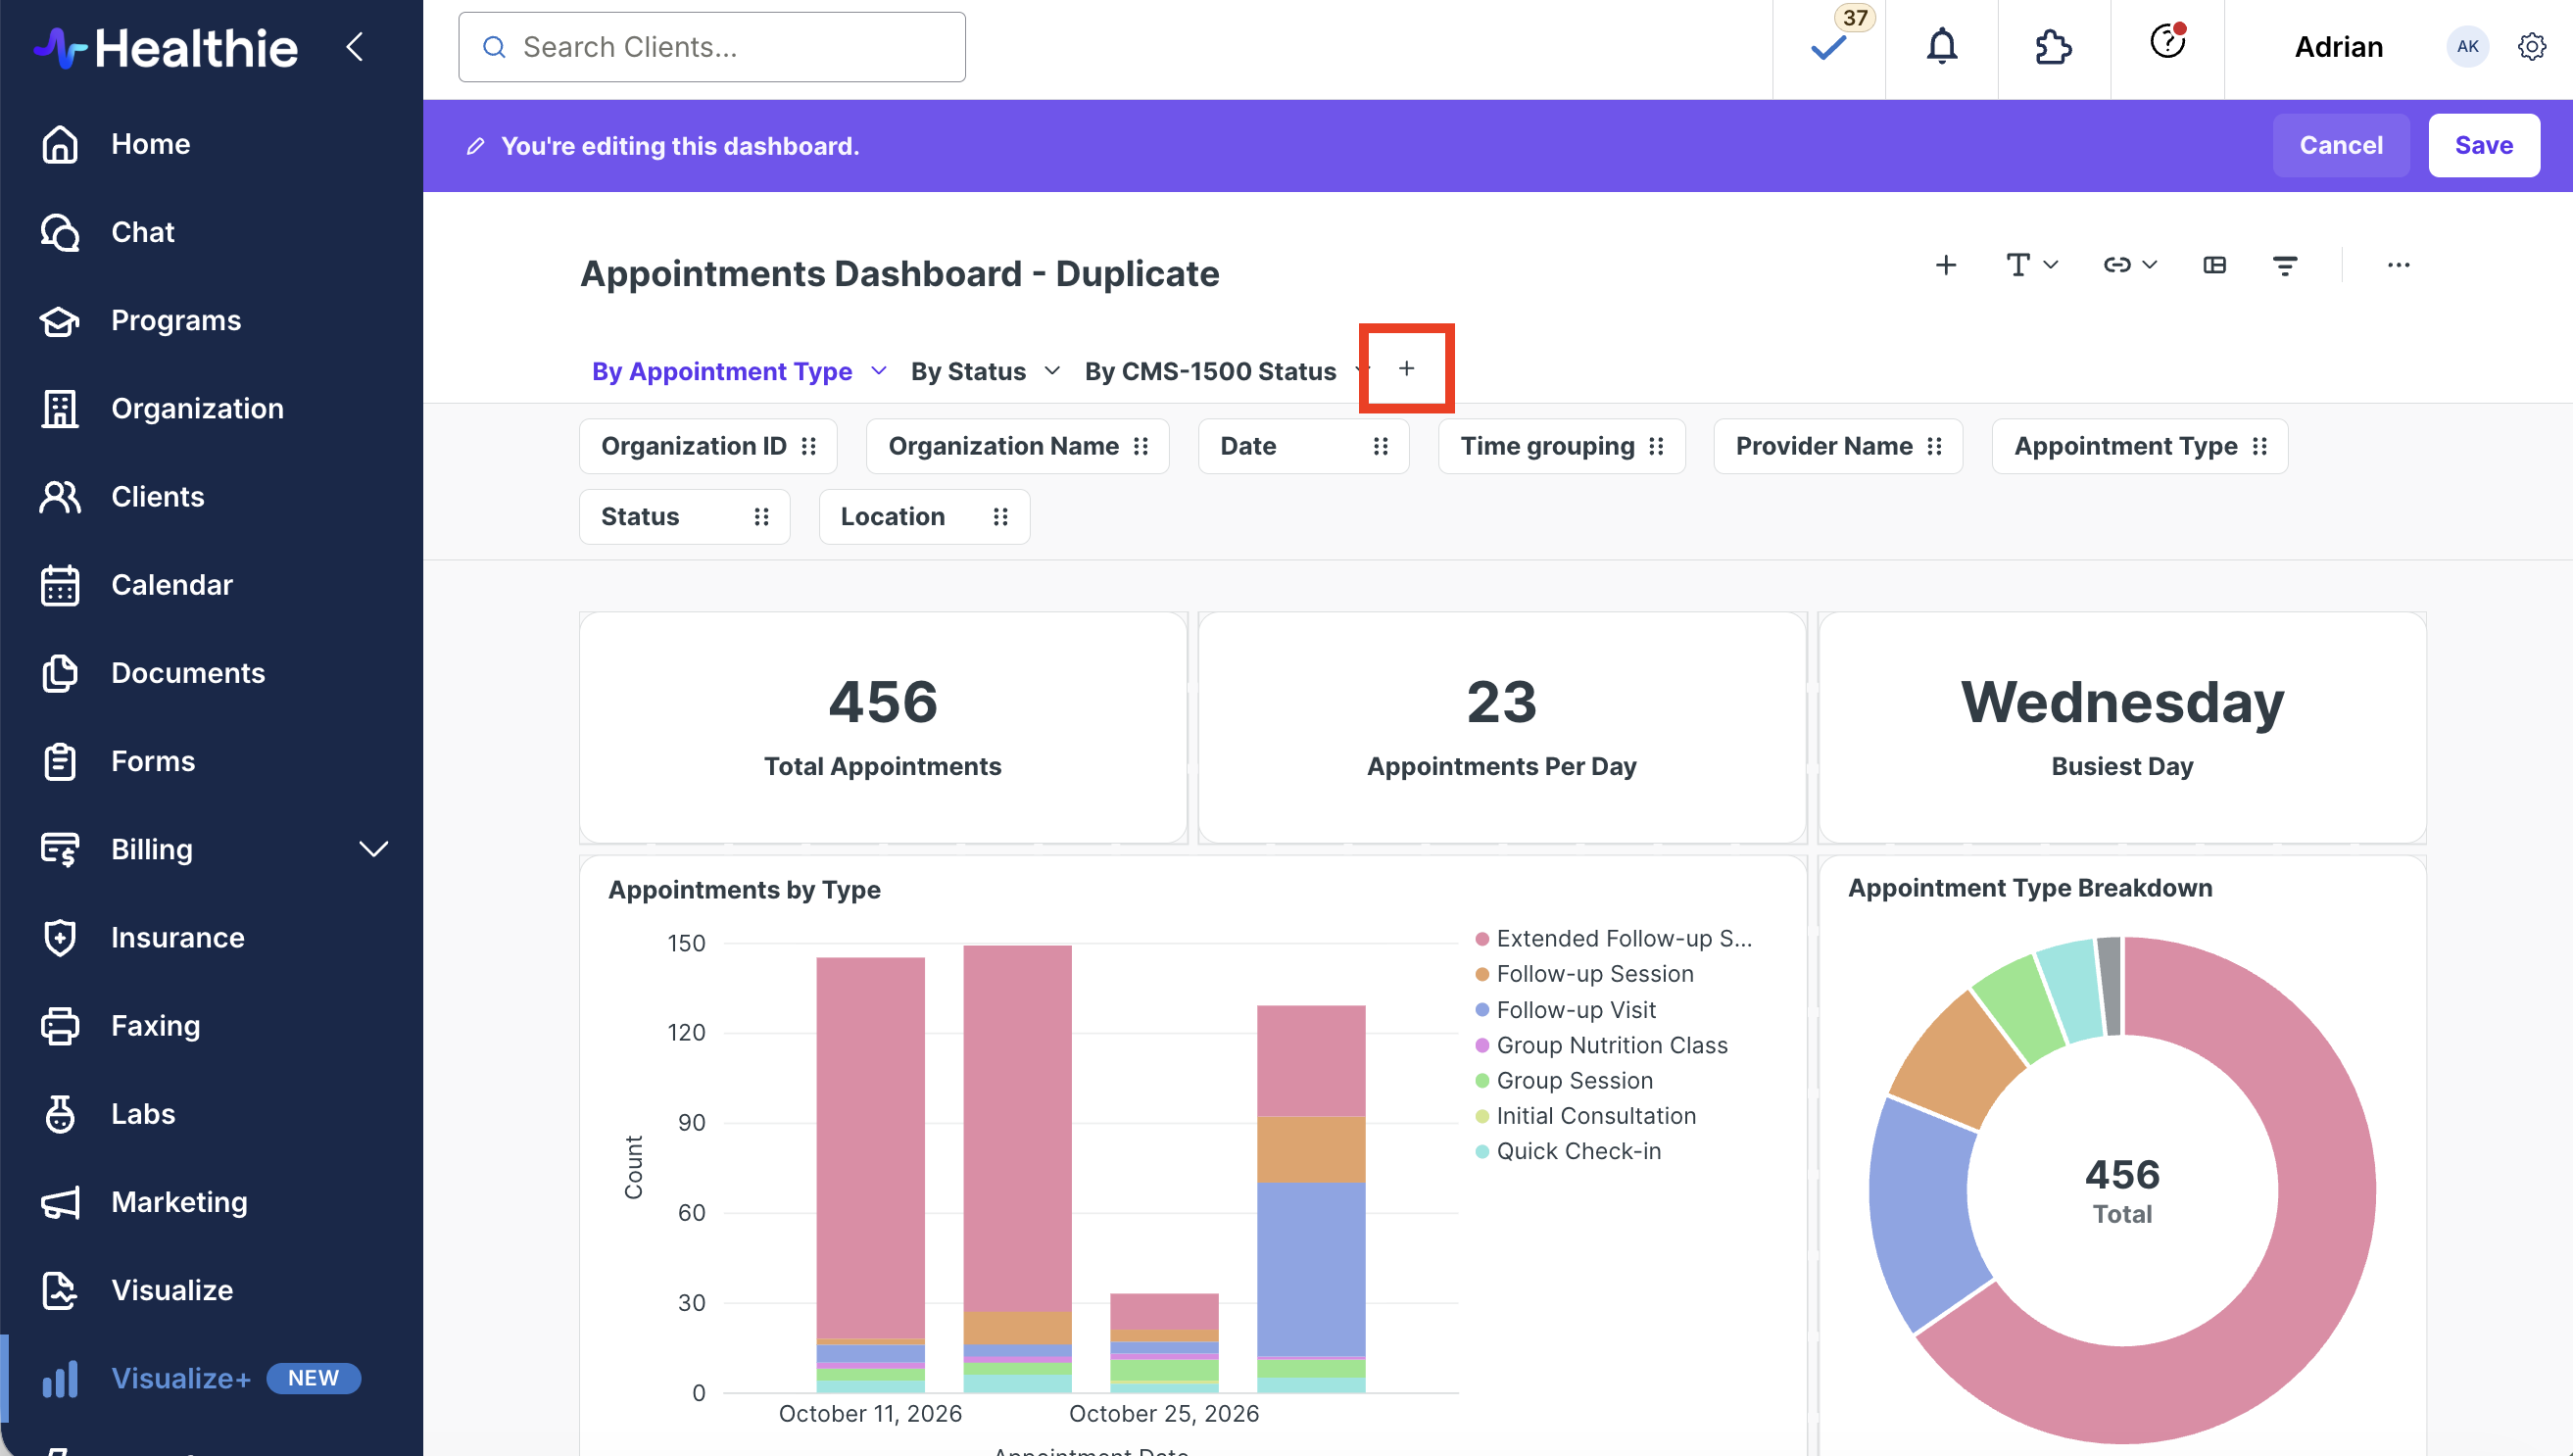
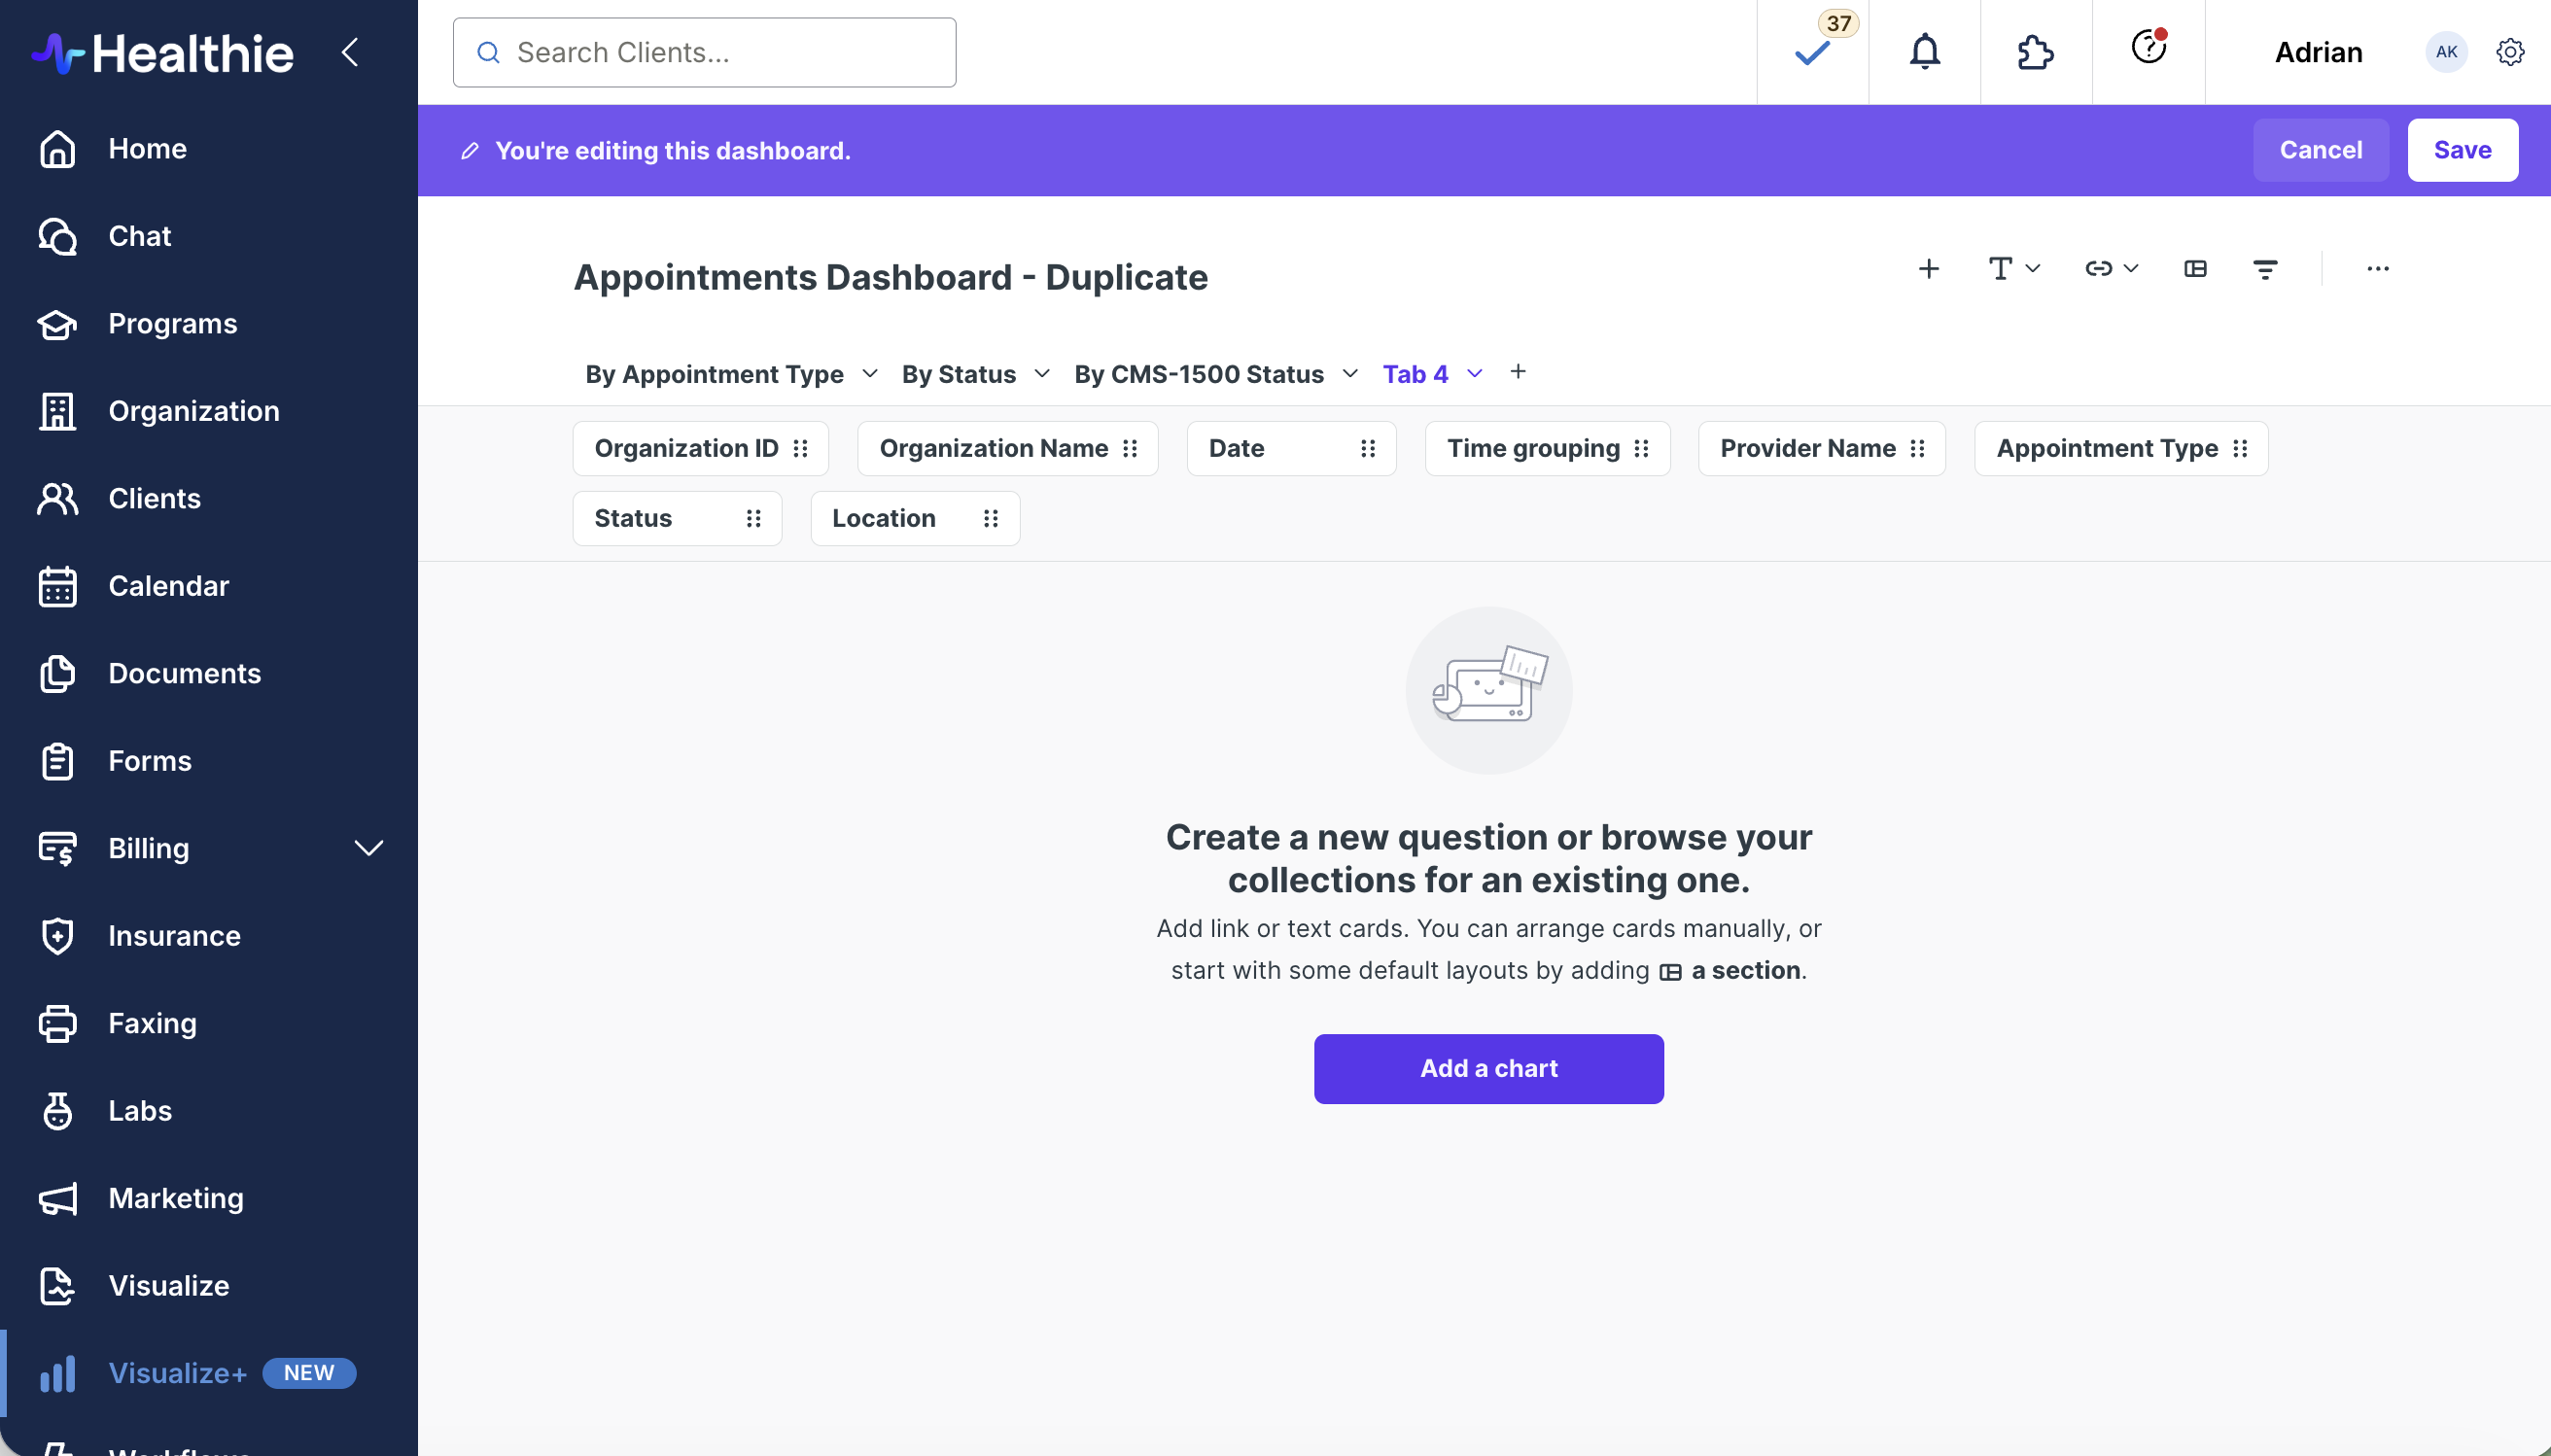
To add a new tab, first duplicate the dashboard and then click on the pencil icon to enter editing mode. Next, click the "+" icon next to the existing tabs.
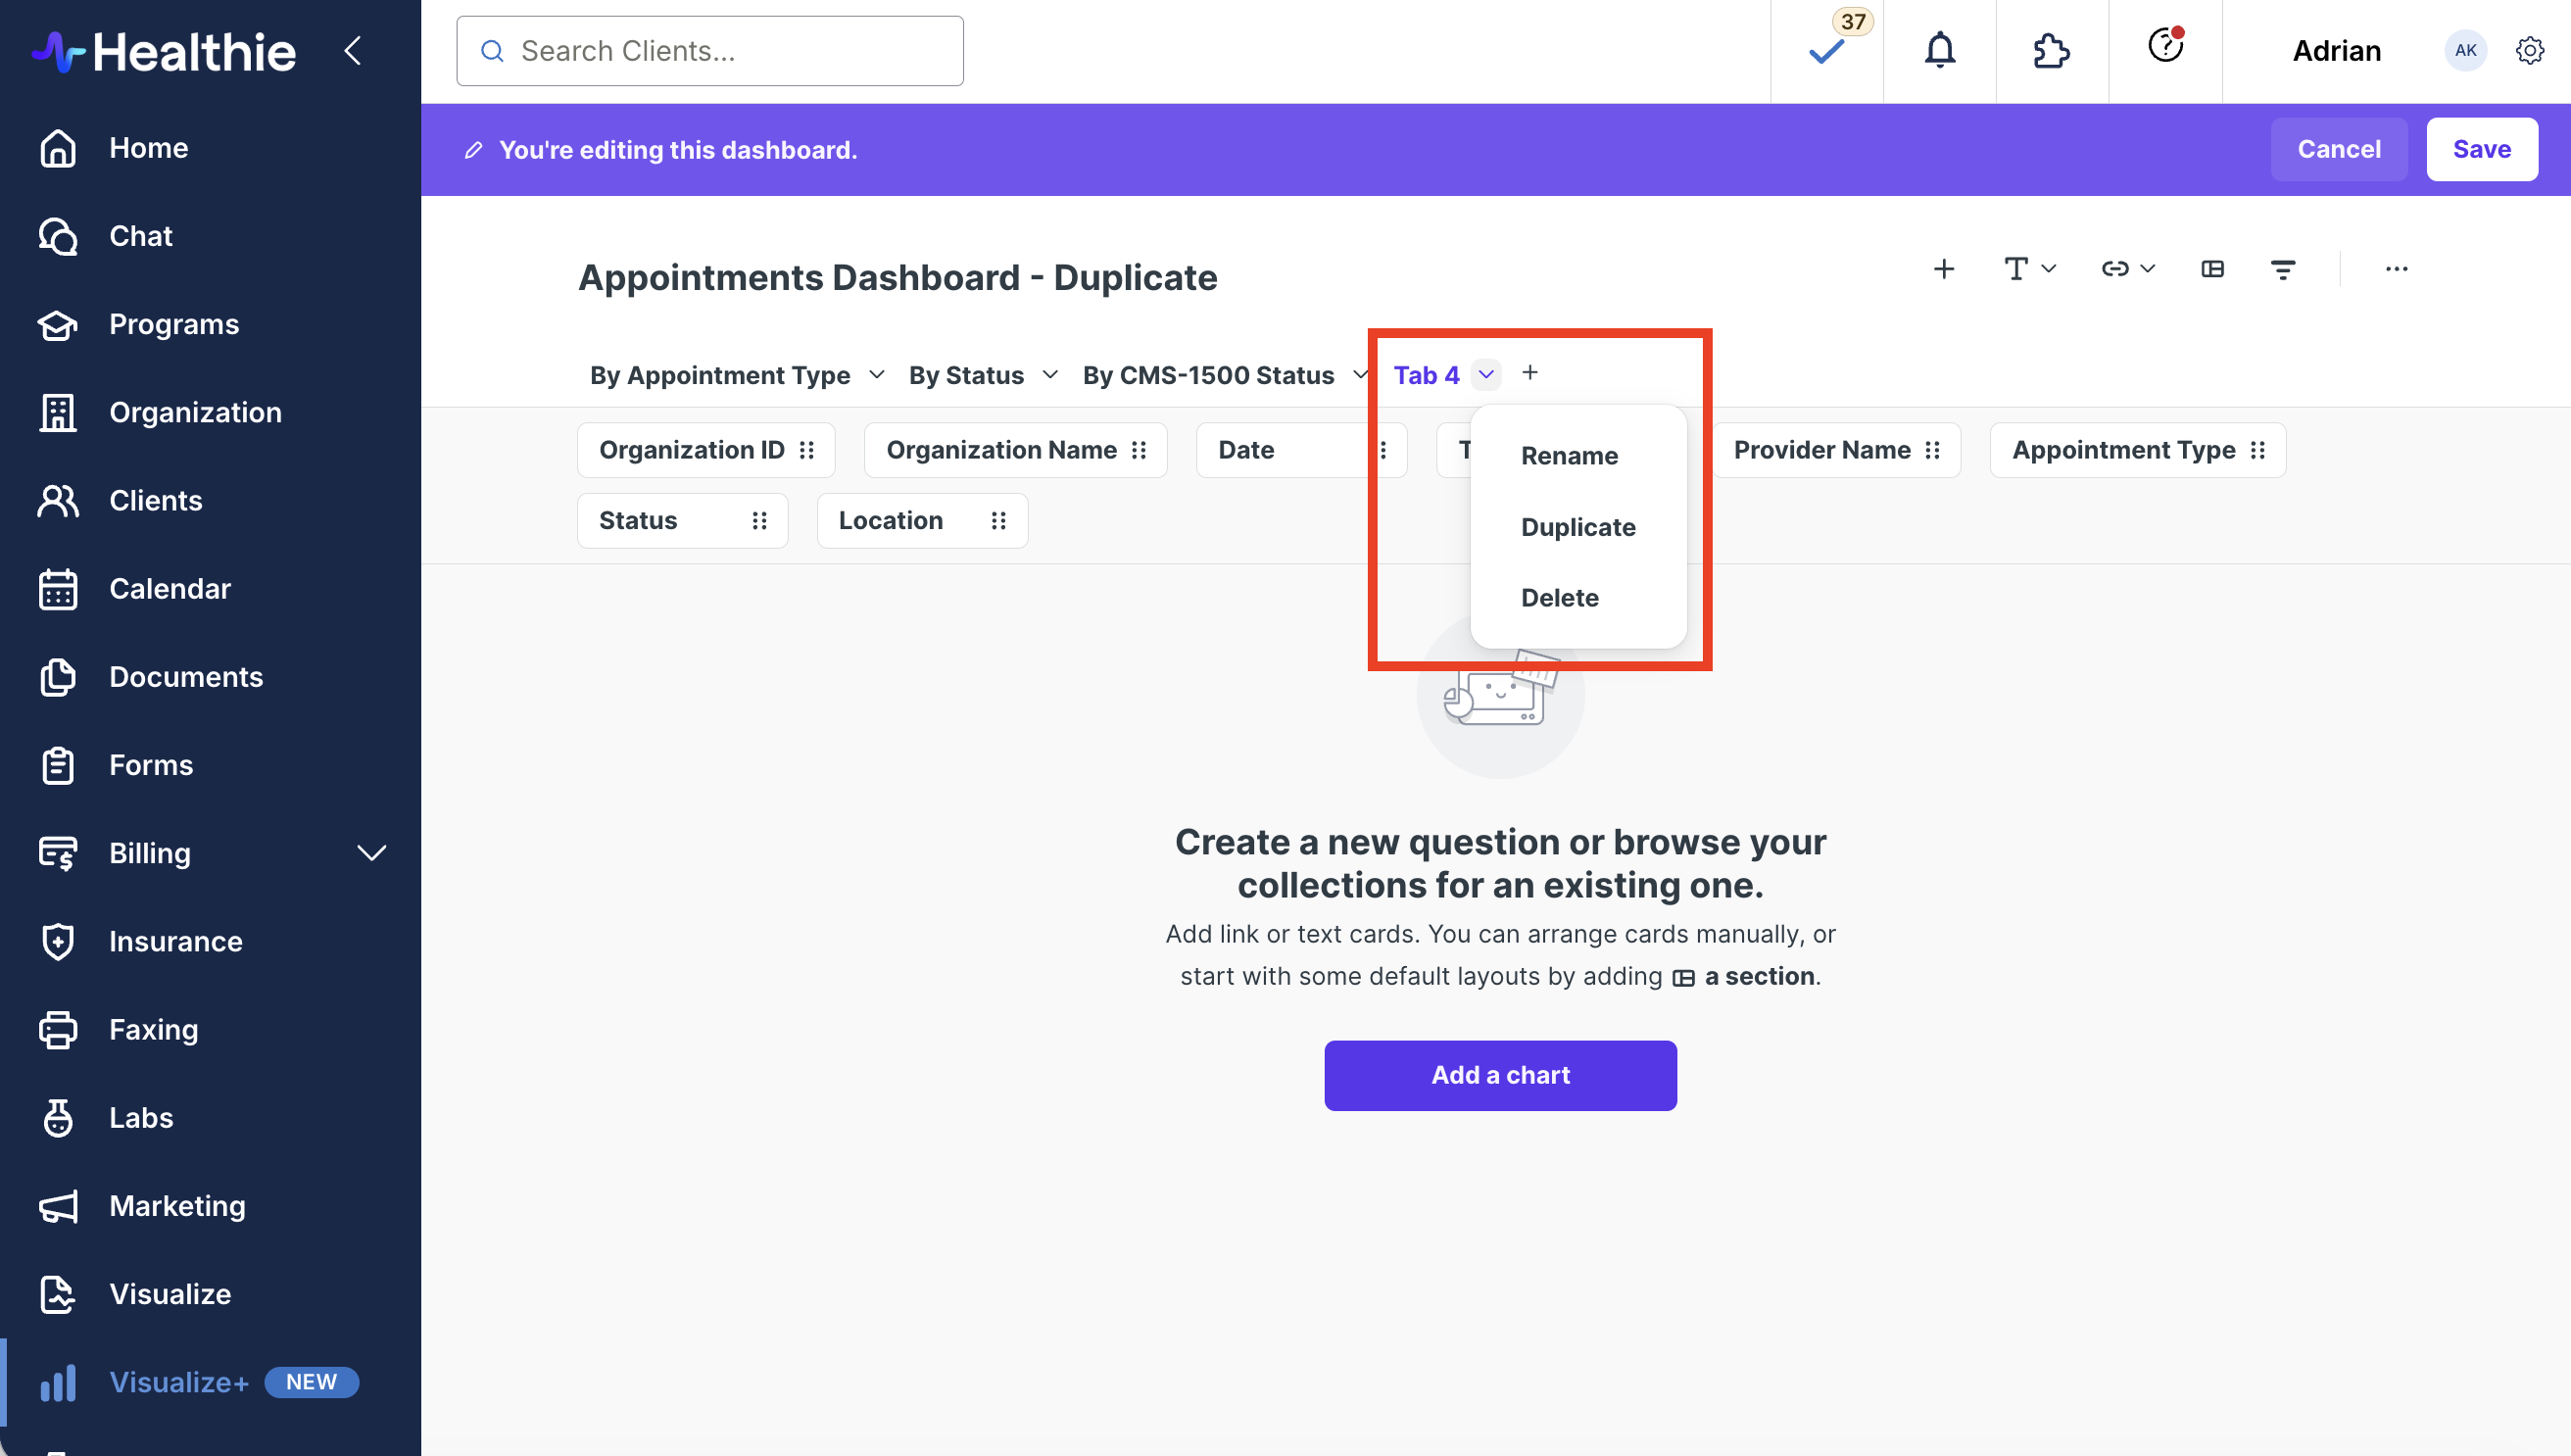
Once you add a new tab, you can change the name by clicking the carrot icon > Rename. You can add questions by clicking Add a chart.

Fullscreen mode
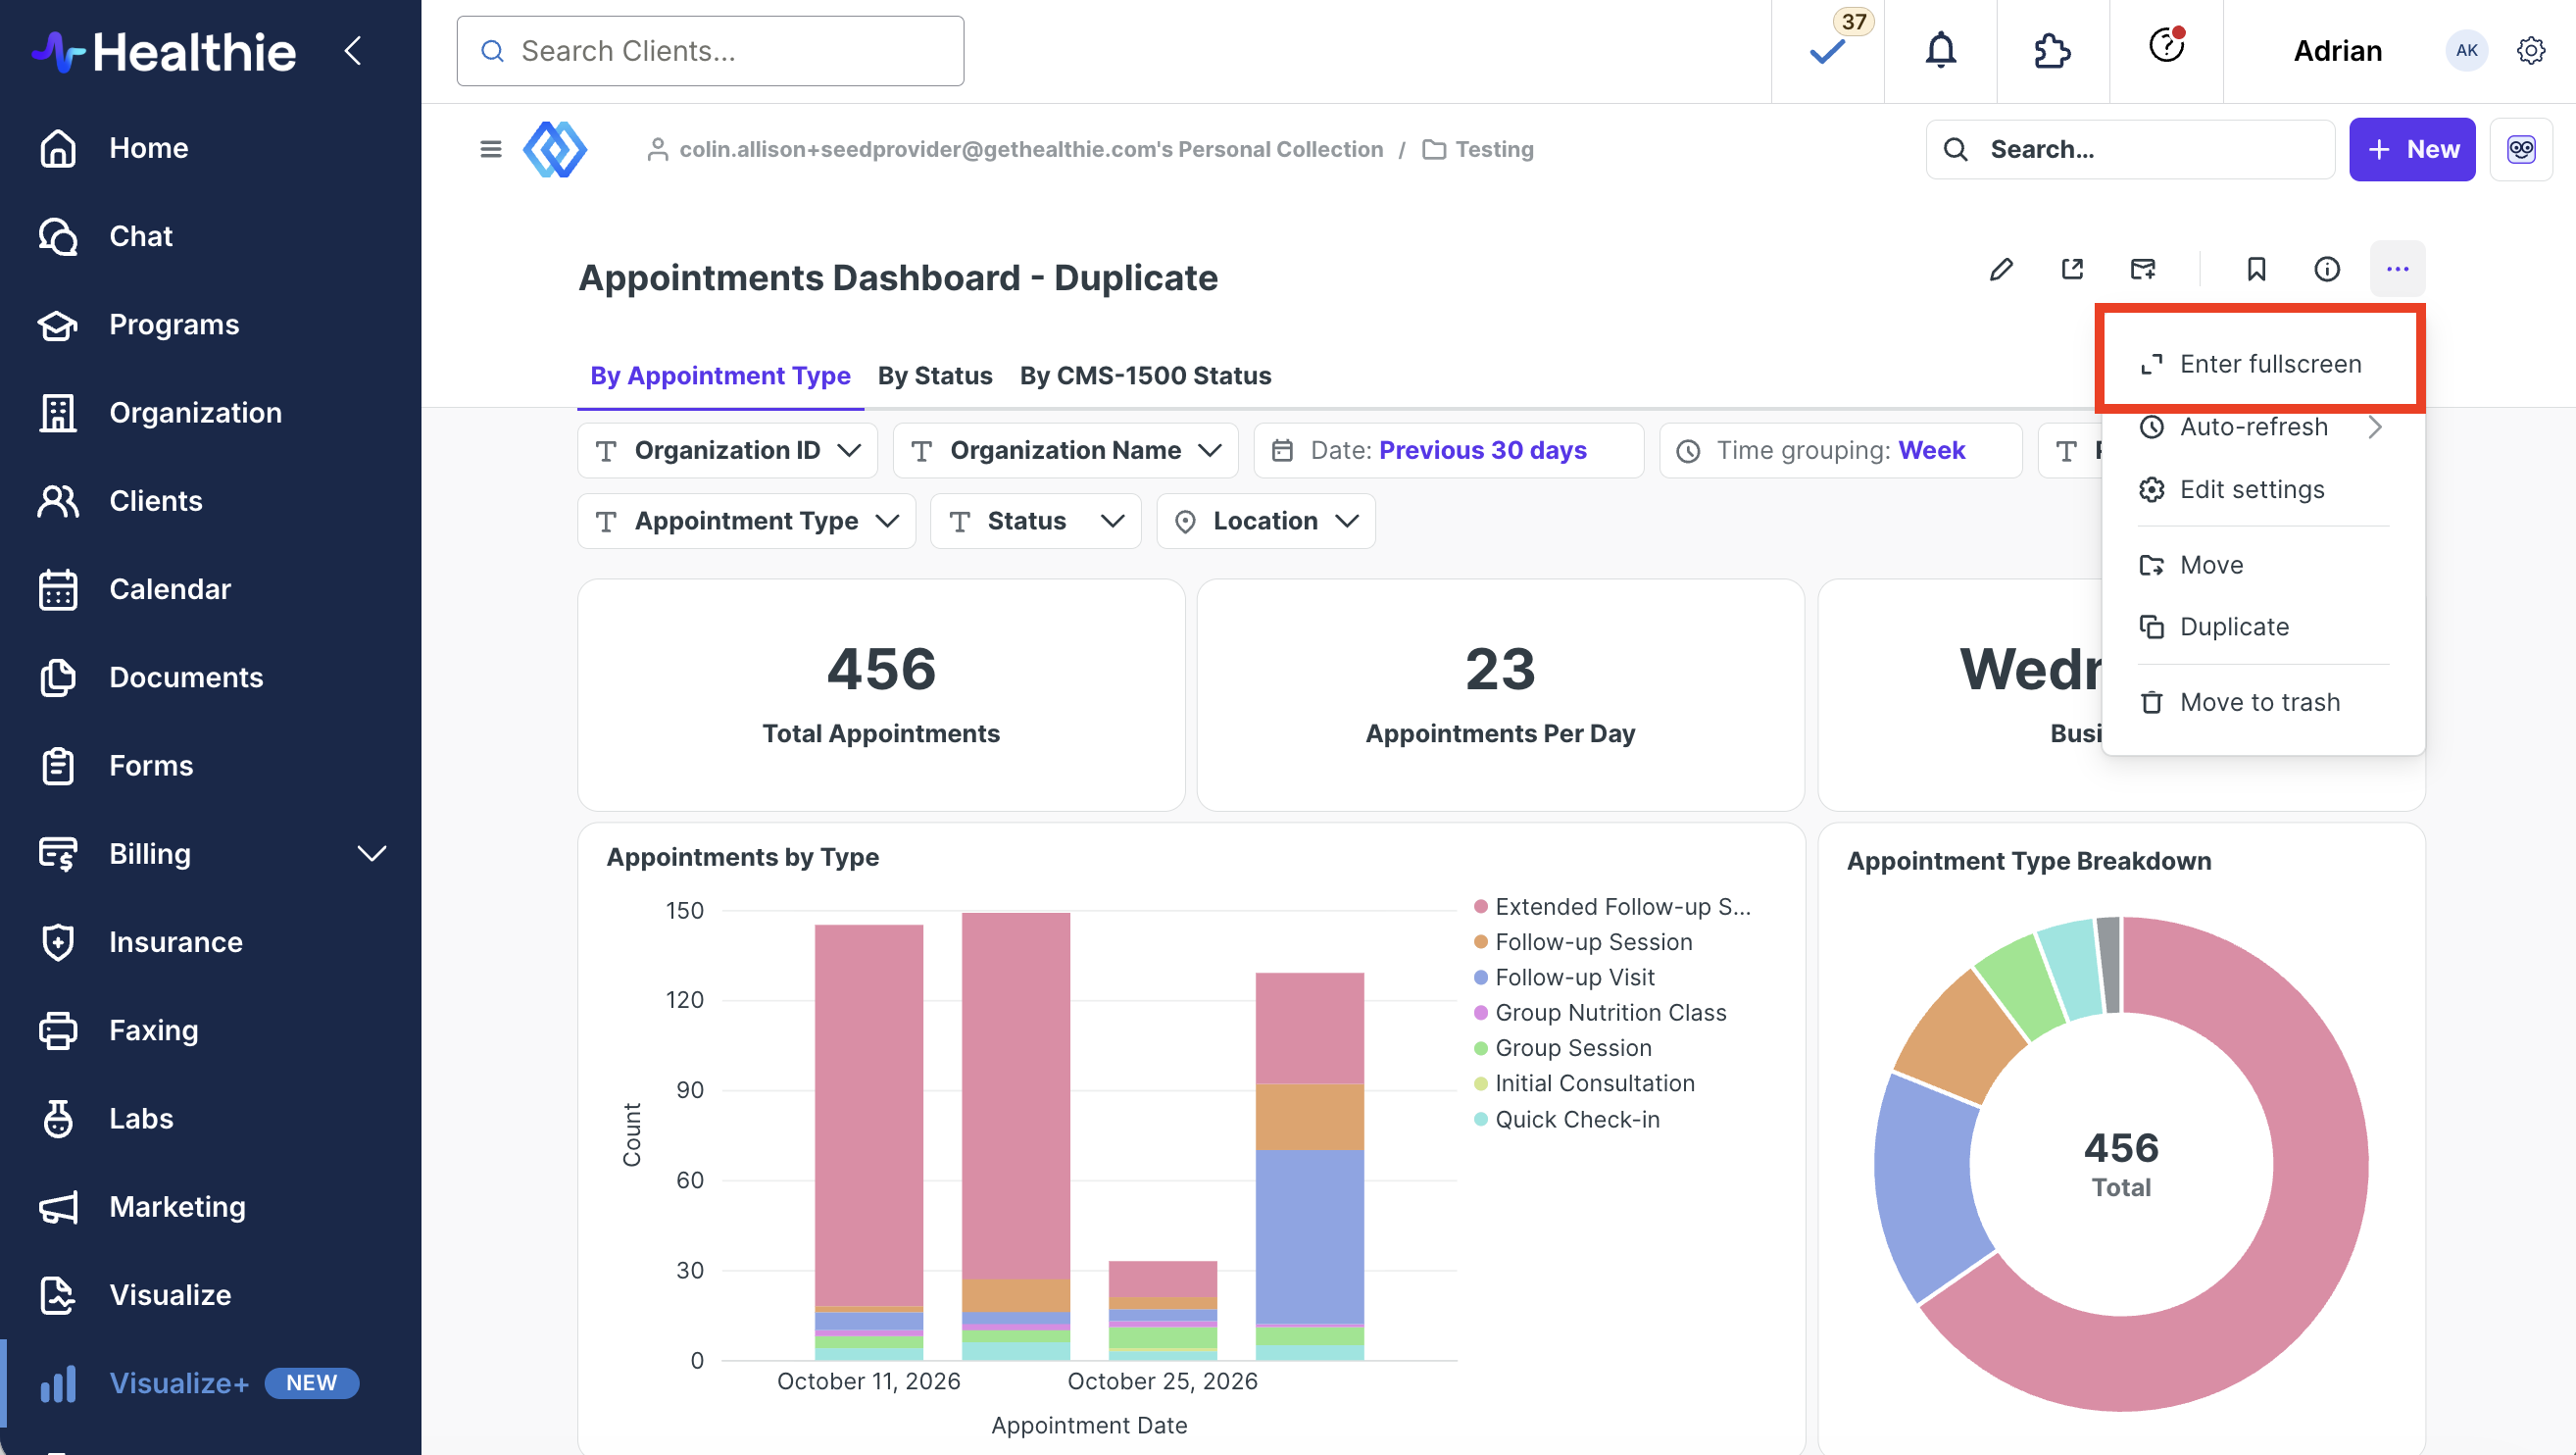
Need to focus on the numbers or share them with your team? You can expand your view using fullscreen mode. This view removes navigation menus and distractions, making it much easier to review your charts and tiles during meetings or deep-dive work sessions.
When in view mode for a dashboard, click […] > Enter fullscreen. To exit fullscreen, click the esc key on your keyboard.
Refreshing data and timestamps
We want you to feel confident that you are looking at the most accurate information available to support your clients and practice.
- Refreshing Data Manually: You can manually refresh the dashboard data to update the tiles and charts immediately by refreshing your browser. The data refresh will still abide by the Snowflake update (hourly or every 24 hours depending on the data).
- Last Updated Timestamp: You can always check the last updated timestamp located on the dashboard. This lets you know exactly when the data was last pulled, so you always know how current your insights are.