Deep Dive: Provider Utilization Dashboard
The Provider Utilization Dashboard enables you to track and analyze how efficiently your providers are using available time. The dashboard helps you identify scheduling opportunities, optimize provider capacity, and understand appointment-to-availability ratios across your organization.
Important Notes:
- The Provider Utilization Dashboard calculates metrics for dates in the past up until today's date. In a future release, the dashboard will calculate and display metrics into the future.
- Customers on shards will not be able to see the Provider Utilization Dashboard graphs
In addition to the .csv file that you can generate, information relevant to Provider Utilization will also display visually within Healthie, allowing you to quickly assess current utilization by organization or provider at a glance.
In this article
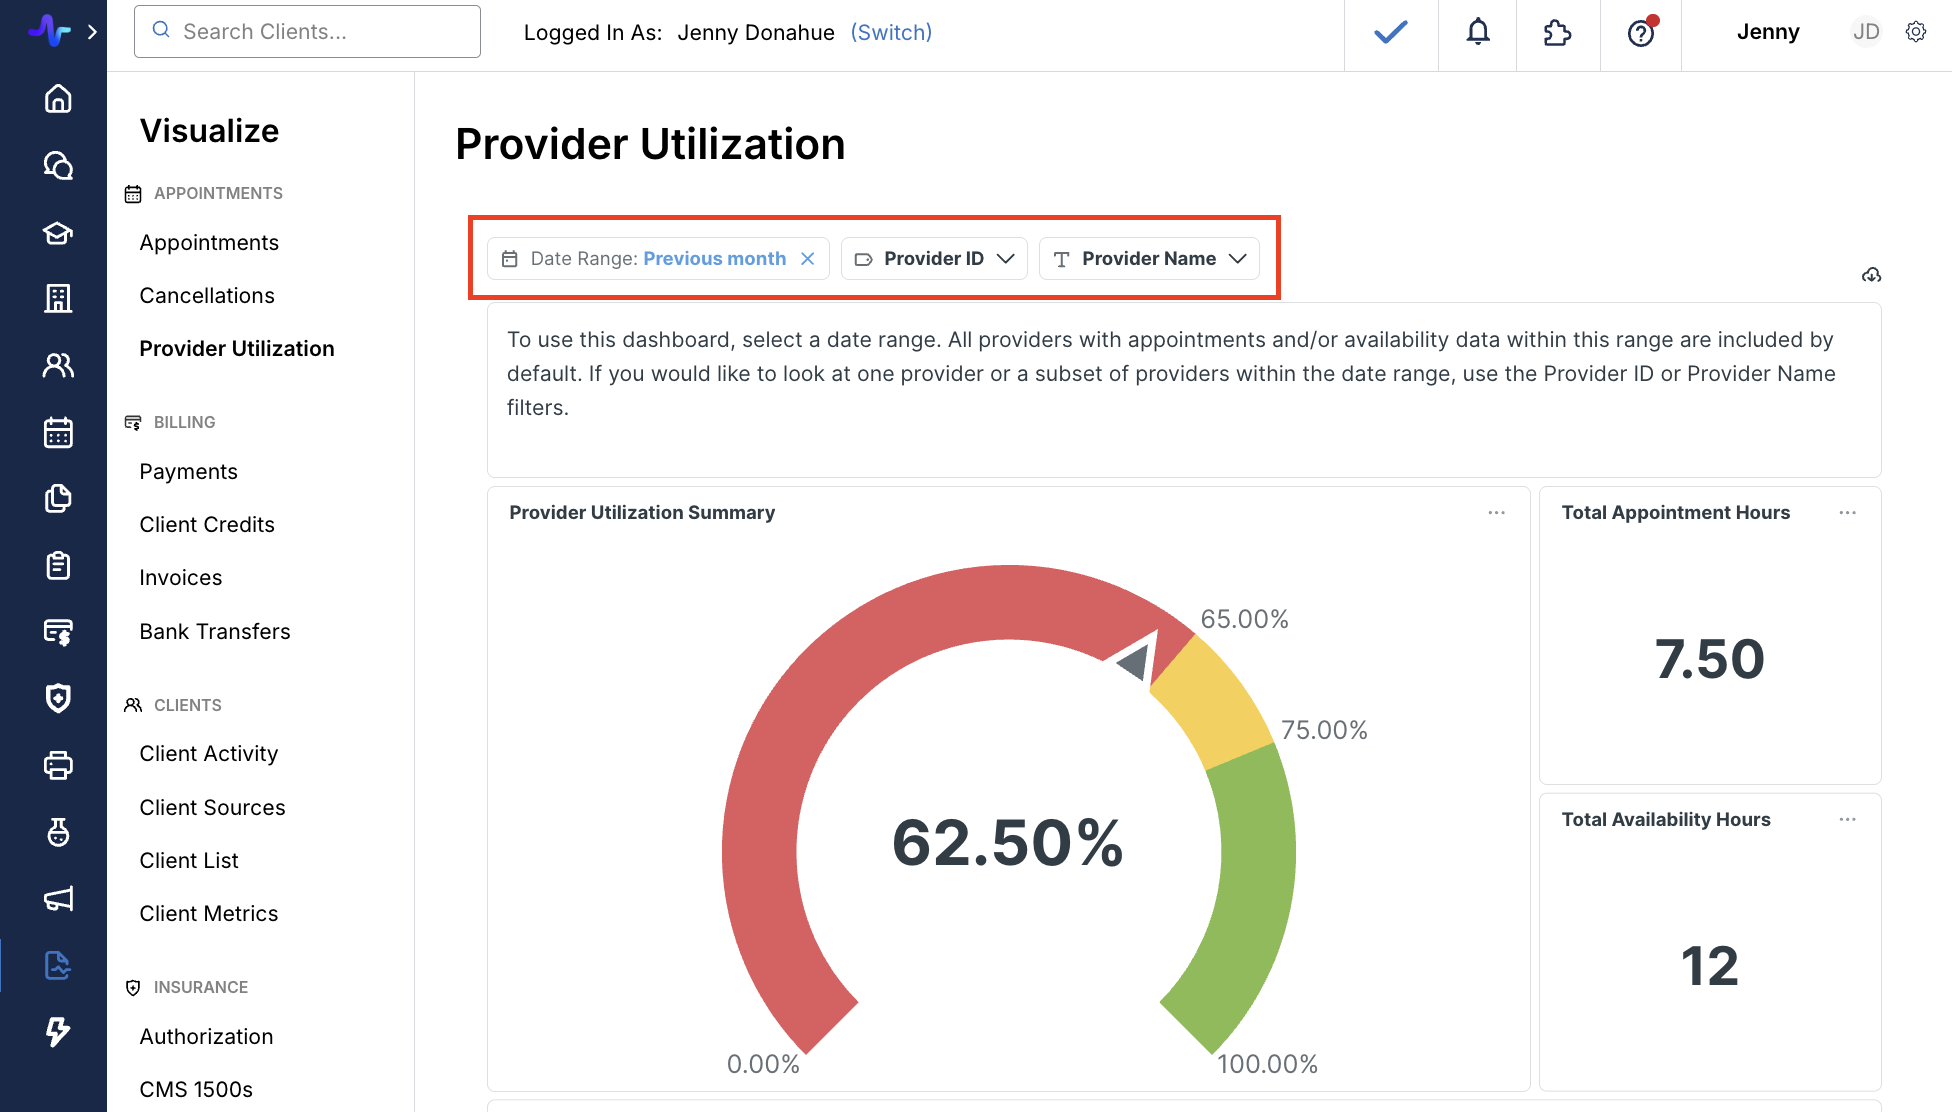
Accessing the Provider Utilization Dashboard
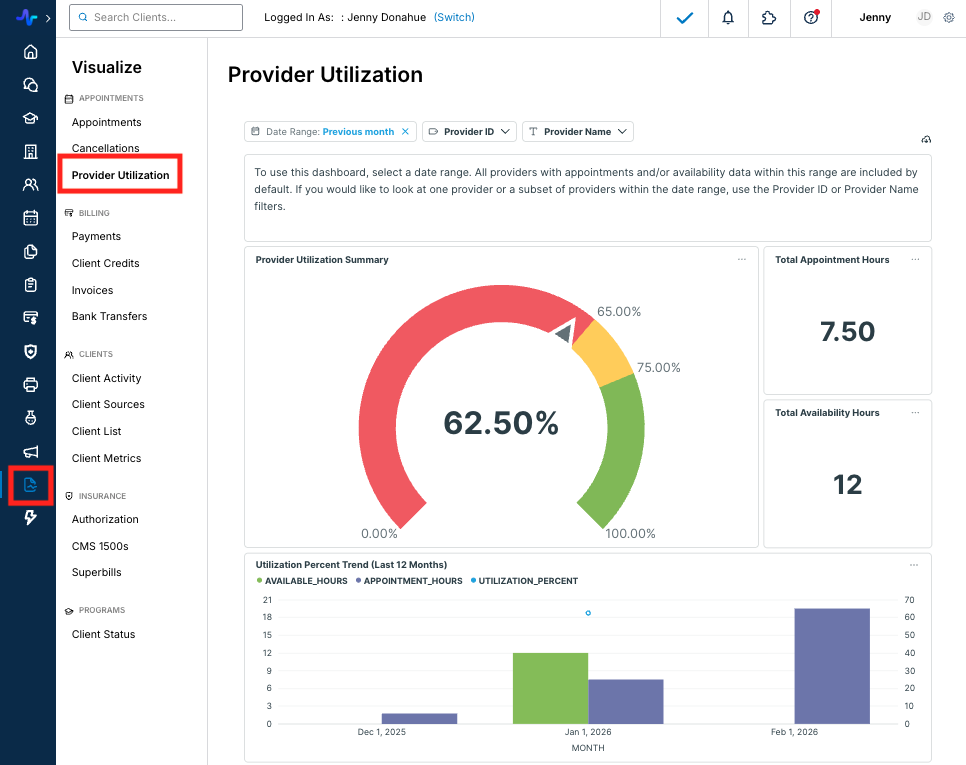
From your Healthie Dashboard, navigate to Visualize > Provider Utilization > Select the Date Range and providers.
Note: the initial view before filtering will include utilization data for all providers
The dashboard is a visual overview of provider utilization. It will default to show all providers that have availability or appointments in the system for an organization.
You’ll see:
- Total Availability Hours
- Total Appointment Hours
- Utilization Percentage
For Organizations, team members need the "Can generate organization reports" permission enabled in order to view the Provider Utilization Dashboard and Report.
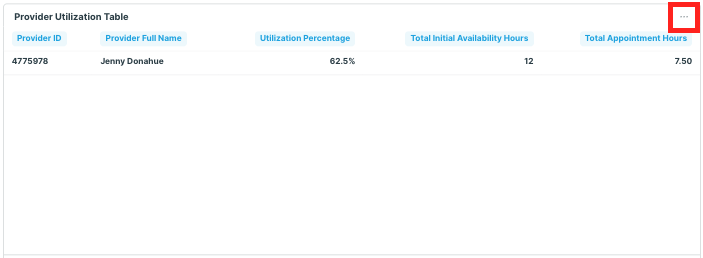
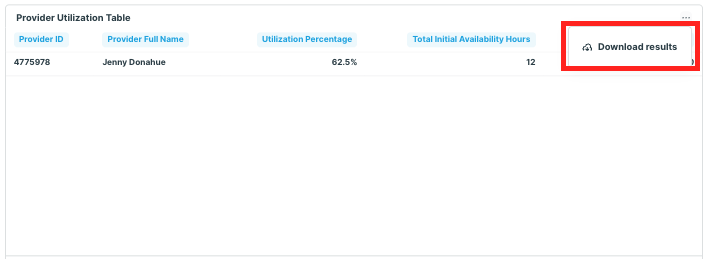
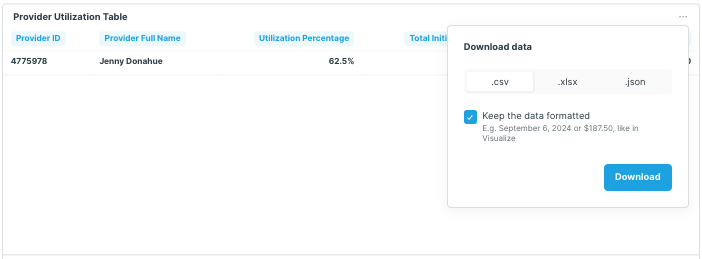
Below the utilization graphs, you'll see the Provider Utilization Table. This is a raw data table with utilization data for the selected date range, and can be downloaded as a CSV, XLSX or JSON file for further analysis. To download the report, click [...] > Download results > select your desired file type > Download. The downloaded file will appear in your devices Downloads folder.
Understanding the Key Metrics
The Provider Utilization Report focuses on three core metrics that work together to give you a complete picture of how your providers are scheduling their time:
- Total Availability Hours: The total hours a provider has marked as available for appointments during the selected date range
- Total Appointment Hours: The total hours of actual appointments scheduled during that same period
- Utilization Percentage: The ratio of appointment hours to availability hours, calculated as (Total Appointment Hours / Total Availability Hours) × 100
These metrics help you identify providers who may have capacity for more appointments, as well as those who are fully booked and may need additional support or scheduling adjustments.
Note: there are scenarios in which the utilization percentage may be skewed.
- A provider with no availability set but scheduled appointments, or less availability set than scheduled appointments will display >100% utilization.
- Duplicate appointments will drive utilization up, as total appointments is a sum of all appointments scheduled.
Total Availability Hours Column
This column displays the total number of hours a provider has marked themselves as available for appointments during the selected date range. This includes all time slots the provider has opened up in their schedule, regardless of whether appointments were actually booked during those times.
Understanding availability hours helps you:
- Identify providers with open capacity who could take on more clients
- Assess whether provider availability aligns with client demand
- Plan staffing and scheduling adjustments
Note: Buffer times will be included in Total Availability Hours, and overlapping/duplicate availability will be merged.
Total Appointment Hours Column
This column shows the total number of hours of appointments actually scheduled with the provider during the selected date range. This includes all appointments that were booked and have a status of Occurred, Checked-In or no status set.
This metric helps you understand:
- Actual time committed to client appointments
- How much of available time is being utilized
- Provider workload and scheduling patterns
Note: Synced calendar events from outside of Healthie will not count towards Total Appointment Hours.
Utilization Percentage Column
This is the key calculated metric of the report, showing what percentage of a provider's available time is filled with appointments.
Formula: (Total Appointment Hours / Total Availability Hours) × 100
Example: If a provider has 40 hours of availability and 32 hours of appointments scheduled, their utilization percentage would be 80% (32 / 40 × 100).
Interpreting utilization percentages:
- High utilization (76-100%): Provider is fully or nearly fully booked. May indicate strong demand or potential need for additional capacity.
- Moderate utilization (65-75%): Provider has a healthy balance with some room for growth.
- Low utilization (below 65%): Provider has significant availability that could be filled. This may represent an opportunity to increase appointments or may indicate the need to adjust availability hours.
Use this metric to identify opportunities for provider support and optimization, balance workloads across your team, and make data-driven decisions about scheduling and capacity planning.
Filtering Options
The Provider Utilization Dashboard offers several filtering options to help you analyze your data effectively:
- Date Range: select custom date ranges to analyze utilization over specific time periods. This allows you to track trends over time, compare different periods, or focus on recent performance. A date range must be selected to view utilization percentage.
- Provider Selection: filter by individual providers to view specific team members' utilization, or select multiple providers to compare performance across your team.
Parent Organizations can log into a sub-organization account to view provider utilization data specific to that sub-organization.
Note: after you select a date range from the "Previous" options, you can click on the Date Range again to view the exact dates. For dates ranges in the "Current" options, you can hover over the Day, Week, Month, Quarter or Year buttons to view the exact dates.
The dashboard currently calculates Utilization Percentage for Previous and Current date ranges, but not Next.


FAQs
Will synced calendar events from outside of Healthie count towards Total Appointment Hours?
No, only Healthie appointments will count toward Total Appointment Hours?
Can I view data into the future with the Provider Utilization Dashboard?
No, currently the dashboard only calculates data for dates in the past and the current day. When filtering by Current Week, Month, Quarter, or Year, the metrics displayed will include data for up to today's date within that time frame.
How does the dashboard calculate Total Appointment Hours?
The dashboard totals the appointment time blocks within a date range, not the actual appointment duration. All appointments with the status of Occurred, Checked In or no status count towards Total Appointment Hours, regardless of whether or not they were scheduled within set availability.
How does Buffer Time factor into Total Availability Hours?
Buffer times will be included in Total Availability Hours.
How does the Provider Utilization Dashboard handle overlapping or duplicate availability?
The Dashboard will merge overlapping or duplicate availability. If a provider has overlapping availability for two different appointment types, the dashboard will merge those into one availability block so the utilization percentage is not under-calculated.
Will the filtering allow organizations to filter by specific time ranges within a date window?
The date range filter allows you to filter by date range, but not by AM/PM hours or specific time blocks.
What if a provider doesn't have any Availability set?
The utilization percentage is calculated with the formula (Total Appointment Hours / Total Availability Hours) × 100. If a provider has no availability or less availability than appointment hours, the utilization percentage will display as greater than 100%.
How quickly will the Provider Utilization Dashboard update when new availability or appointments are added?
You can expect a lag of up to one day for this dashboard.
How does the Provider Utilization Dashboard handle appointment blocks?
Appointment blocks are not factored into Total Availability Hours. The dashboard only counts time explicitly marked as available, blocked time is invisible to the calculation entirely.